TUAC NEWS
OECD’s How’s Life confirms high inequality levels, long-term risks and the need to bring well-being objectives into policy thinking
14/10/2015
OECD’s How’s Life confirms high inequality levels, long-term risks and the need to bring well-being objectives into policy thinking
The OECD releases its How’s Life 2015 report at the World Forum on Statistics, Knowledge and Policy on October 13 (www.oecd.org/std/how-s-life-23089679.htm ). The publication focuses on measuring people’s well-being beyond GDP, claiming that it should become a key policy objective in the future.
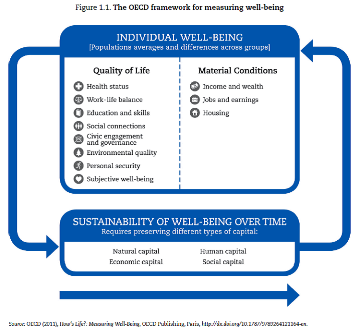
The measuring framework (see chart below) looks at the quality of life (namely on health, work-life balance, education and skills, social connections, etc.), material conditions (income and wealth, jobs and earnings, and housing) and on different types of capital in view of well-being conditions over the long-term.
This year, the report is specifically focussing on child well-being, volunteering and inequalities. In regard to child well-being, the findings display that children from poorer families are paying a high price for rising inequality, income poverty affects 1 child in 7 in the OECD area alone and 1 in 10 children live in workless households.
The multi-dimensional well-being outcomes identify areas of relative strength and weaknesses in all countries as average measures do not paint a full picture of disparities between OECD members. As such, countries with higher GDP per capita ratios tend to perform better, although this is not the case for every indicator. According to the report, “when it comes to well-being, no country has it all: rich nations are still leaving people behind”. Meanwhile, around 60% of those counties with intermediate GDP levels show lower results in educational attainment, adult skills, working hours and housing affordability. The group of countries with lower levels of GDP (11 countries) perform less well across all indicators. However, half of the countries have strong results in educational attainment and housing affordability, and one quarter performs well in terms of job security.
The reports’ main findings relevant to trade unions’ focus on employment, income distribution and skills are as follows:
Material well-being
· “Material well-being” has recovered only slowly since the financial crisis as average household adjusted disposable incomes (HADI) in 2013 were only 1,9% higher than in 2009 – and fell in one third of OECD countries in real terms. Disparities between OECD countries are substantial: the US HADI is three times higher than in Hungary or Mexico. Italy (- 9%), Spain (- 11%), Portugal (- 9%) and Greece (- 30%) in particular show sharp levels of decline in in household income. Ireland (- 18% in household income), the Netherlands, Slovenia and Denmark saw a drop in material conditions in view of unemployment, earnings, and household income (except for Denmark). The largest gains in household incomes were in Russia (18%), Norway (8%), Mexico and Korea (both 12%).
· The top 1% are wealthier than those in the bottom 60% combined in the OECD area: the inter-decile income ratio increased in the US, the UK, Luxembourg, Israel, Italy and Mexico, pointing to the fact that a larger share of income goes to the top 10%. It is at much lower levels in Denmark, the Czech Republic, Slovenia and Finland. Wealth is even more unevenly distributed than income, “on average, the [bottom] 60% own around 13% of household net wealth, while the top 1% owns 18%”.
· Gini coefficient data shows that income inequality increased in Luxembourg, New Zealand and the US but fell in Israel and the Slovak Republic. Based on 2012 data, it is generally highest in Mexico, the US, Turkey and Israel, and lowest in Norway, Slovenia, the Slovak Republic, Denmark and the Czech Republic.
· The average gender pay gap is at 15, 5% in the OECD area.
· Long-term unemployment has risen in over two thirds of OECD countries, increasing from 1.95 to 2.64% on average. Comparing 2009 to 2014 levels, it is over five times higher in Greece, it tripled in Denmark, the Netherlands, Slovenia and Spain and doubled in New Zealand, Ireland, Italy and Portugal. It only fell (albeit only by one percentage point) in Israel, Germany and Turkey.
· The probability of becoming unemployed fell on average, but increased in one quarter of OECD countries amongst them Portugal, Italy, the Netherlands and Greece. For example, 1 in 10 workers are affected in Greece, 1 in 7 in Spain, 1 in 11 in Turkey and 1 in 15 in Portugal.
· In two-thirds of OECD countries, young people (aged 15-24) are more likely to be long-term unemployed than older workers. The number of youth, who are out of the labour market for a longer period of time, doubled in the UK, Belgium, Australia, Hungary and Luxembourg. In Italy, 1 in every 4 young adults is long-term unemployed; in Greece, it is 1 in 3. As the report points out, young people are also more in “non-regular employment, with a high incidence of temporary work, often coupled with low transition rates from temporary to permanent jobs”.
· Over-indebtedness is at the highest level among middle-income earners and young people.
· The data on work-life-balance shows that the number of those working “very long” hours rose by 0, 7% on average in the OECD in 2013 (compared to 2009) with 6, 9 % in Chile and 4, 4 % in Portugal.
· On education and skills, the report flags that only three-quarters of 25-64 year olds have an upper secondary degree with fewer than 60% in Italy, Chile, Spain, Portugal, Mexico and Turkey. However, overall educational attainment increased in almost every OECD member state. The report rightly underlines that educational outcomes and the distribution of skills is strongly linked to a person’s socio-economic background.
Future well-being
· Human capital: although there is evidence that more working-age people have at least an upper secondary education degree in the OECD area, the educational attainment level of younger people (aged 25-34) is either stagnating or declining in many countries, while long-term unemployment remained above 2009 levels, which both pose a long-term risk.
· Economic
capital: the net financial wealth of households is
higher than in 2009, however, fixed capital investment levels
continued to be considerably low since the crisis and indebtedness
remains a critical factor. In 2013, household debt in over a half
of OECD countries was higher than in both, 2000 and 2007 (with the
exception of the US, UK and Spain – with a peak in 2007; Ireland,
Estonia and Denmark – in 2009; Portugal – in 2012).
(check the report for more findings, specifically on
social and natural capital)
OECD activities on well-being beyond How’s Life
While the shift to focussing more on well-being, including the quality of jobs and level of earnings, is a positive step within the OECD, the approach has to be mainstreamed in its different policy departments and their recommendations. This is not yet the case. The report refers to the Economic country surveys as an example, where the well-being dimension has been integrated. However, some of the policy recommendations in the latest surveys remain along an orthodox line of reasoning and do not take well-being impacts fully into account.
Another example are the multi-dimensional surveys, produced by the OECD Development Centre that are much more based on a multi-dimensional perspective (see the latest survey on Peru: http://www.oecd.org/dev/multi-dimensional-review-of-peru-9789264243279-en.htm). In view of the newly adopted Sustainable Development Goals (SDGs), the report confirms the organisation’s intention to contribute to the global statistical capacity-building for the SDG monitoring process. It also points to the fact the OECD’s Inclusive Growth project will integrate a measurement framework on income, employment and health in order to shed light on growth effects on living standards. Lastly, the report announces a longitudinal study (from 2019 onwards) on the impact of social and emotional skills on well-being outcomes and economic progress.
Going forward, the depth and credibility of future reports and activities will depend on the quality of data and the pre-determined focus. How’s Life identifies several ongoing and future OECD activities that might deliver valuable orientation for future policy pathways:
· An “OECD Job Quality Framework” with a data base available at the end of 2015, followed by the establishment of “Guidelines” based on three indicators (earnings quality – in terms of income levels and distribution; labour market security – including the risk of unemployment, its expected duration and social safety nets; quality of the working environment – including incidence of job strain and job ressources);
· Database on the distribution of household wealth in 18 OECD countries (http://stats.oecd.org/Index.aspx?DataSetCode=WEALTH );
· Online tool enabling to compare perceptions on income inequalities ( www.oecd.org/statistics/compare-your-income.htm);
· Gender Data Portal focussing on education, employment and entrepreneurship (www.oecd.org/gender/data );
· A new system of Environmental Economic Accounting (SEEA) and further follow-up on the OECD Green Growth Indicator Initiative (2014);
· Hosting of the High Level Expert Group on the Measurement of Economic Performance and Social Progress (HLEG) – which is a direct outcome of the Stiglitz, Sen and Fitoussi Commission.