TUAC NEWS
THE OECD NOVEMBER 2016 GLOBAL ECONOMIC OUTLOOK: ESCAPING THE LOW GROWTH TRAP?
28/11/2016
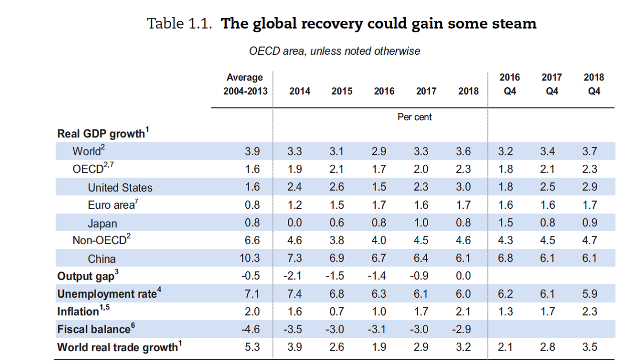
The OECD in its latest Economic Outlook, published on the 28th of November, continues to point to the “low growth trap”, the global economy has found itself in over the past five years, but now predicts that growth could “gather some steam” (http://www.oecd.org/economy/outlook/economicoutlook.htm). Average growth in the OECD is projected to accelerate noticeably from 1.7% in 2016 to 2.3% in 2018 (see table below), with growth in the US in particular forecast to double from 1.5% in 2016 to 3% in 2018.
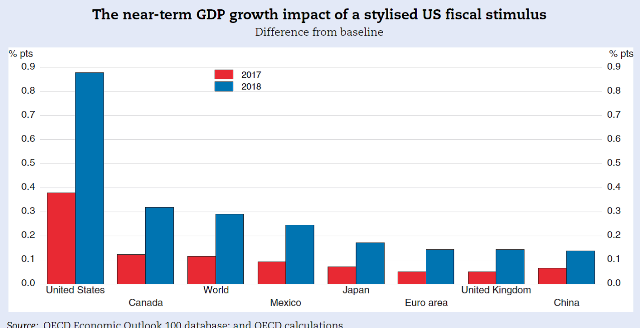
The main reason given for this assumption is that the incoming US administration would opt for a fiscal stimulus from 2017 on, resulting in 1.75% of GDP in 2018. Public consumption and investment would increase by 0.25% of GDP in 2018 and personal income taxes and corporate taxes would be cut by 0.5% and 0.75% of GDP respectively. Such tax stimulus is supposed to prop up US GDP by almost 1 percentage point in 2018 with spill overs of 0.15 to 0.3 pp in China, the Euro Area and Canada (see next graph). This is a rash assumption by the OECD when the incoming US President has barely set out any credible economic proposals.
China and, to a much more limited extent,
the Euro Area are also expected to go for a fiscal stimulus: 1% of
GDP in both 2017 and 2018 in the case of China and 0.3% of GDP in
2018 in the Euro Area.
Shifts in the OECD analysis
- Up until now, the OECD was very clear in its defence of expansionary monetary policy. This Outlook however sees the “status quo dependence on extraordinary monetary policy” to “involve financial risks”. With 36% of OECD sovereign debt carrying negative yields, it warns that a significant and/or abrupt bond price correction could lead to financial assets fire sales, increased counterparty risk and a renewed credit squeeze. Another example is the description of the rapid pace of debt accumulation in Emerging Market Economies (EME’s) with loose monetary policy driving debt-to-GDP ratios to high levels in several of them.
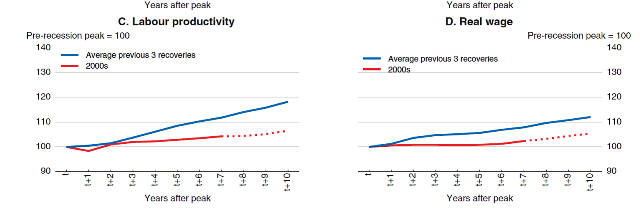
- Another shift in the narrative concerns the role of wages. While the OECD expresses concern about the fact that real wages have barely risen and identifies this as one of the factors explaining the weakness of the recovery, it now explains weak growth in real wages as being caused by low growth in productivity. This is expressed in the graphs below. It can be seen that real wage growth over the ten years after the pre-crisis peak has closely mimicked weak productivity growth. This focus on ‘weak productivity growth’ and speculation on the reasons behind it, provides the OECD with the opportunity to shift the policy discussion back to the implementation of productivity enhancing structural reforms instead of reforms that ensure a more wage friendly distribution of productivity gains.
- Despite “Brexit” and mounting concern about impacts of trade and investment liberalisation, the OECD insists that trade policy is an “integral part of the [structural] policy packages”. Unnecessary trade costs and impediments to cross border investment thus need to be tackled.
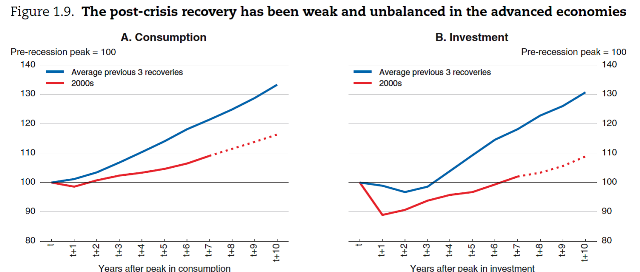
- Worth noting is how the OECD illustrates the sluggishness of the current recovery by showing how consumer demand as well as investment expenditure have both been persistently weaker compared to previous recoveries (see graphs below). It is striking that investment has even failed to keep pace with the modest upturn in consumption demand.
Evaluation
It has by now become clear that monetary policy is
‘pushing on a string’ and that fiscal stimulus has an essential
role to play in lifting economies out of the low growth trap.
However, the way in which the OECD is estimating the growth effects of the new fiscal policy plans of the incoming US administration raises a critical question. Whereas until now the OECD was pushing for a fiscal stimulus in the form of a coordinated increase in public investment spending, the stimulus that would now be in the pipeline is mainly and almost exclusively a tax cut operation. This could boil down to a tax cut mainly benefiting top incomes and corporate interests (see for example: http://www.epi.org/blog/big-gap-between-trumps-promises-middle-class-and-his-policies/?mc_cid=1940336c42&mc_eid=656b3b68b7). To assume that this will “boost demand significantly” (page 48 of the Outlook) is exaggerated as the propensity to save is much higher for top income earners.
Even more importantly will be the impact on inequality. While the OECD claims that corporate tax cuts will create jobs for the ‘vulnerable’, the net effect of massive tax cuts for the rich combined with what most likely will turn out to be a modest improvement of the economy will result in another hike in inequalities.
Reading between the lines (see box 1.1), the
OECD seems to be aware of at least the first issue as it includes
several points of caution:
“The stimulus could raise potential output in the longer term (…) if businesses respond (…) by durably raising capital investment rather than by raising dividends or financial investments but the extent to which this occurs is very uncertain”.
“To the extent that higher income households or cash rich companies benefit from lower taxes than otherwise, the resulting additional revenue might be saved rather than used to finance additional final expenditure”.
A more convincing message appears in another chapter (Chapter 2 “Using the Fiscal Levers to Escape the Low Growth Trap” - see a separate TUAC assessment here: http://www.tuac.org/en/public/e-docs/00/00/12/A9/document_news.phtml), in which the OECD is openly calling for a modification of the application of the EU Stability and Growth Pact by excluding net public investment from the fiscal rules, as existing fiscal rules could limit the recourse to fiscal expansion in about half the countries considered (see special text box in chapter 2 of the EO).
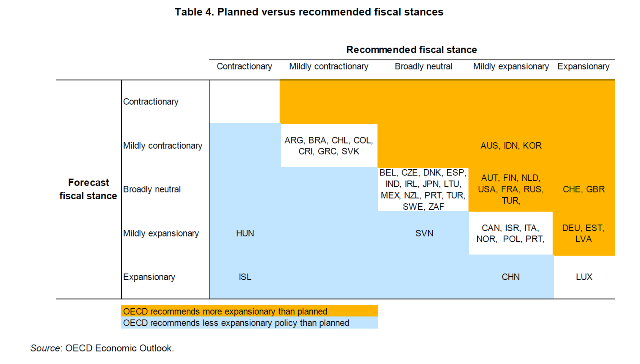
The table below summarizes the OECD’s fiscal policy recommendations for its member states and some emerging economies.